本文实例为大家分享了C#根据excel数据绘制坐标图的具体代码,供大家参考,具体内容如下
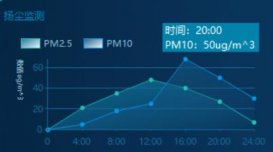
效果如下图
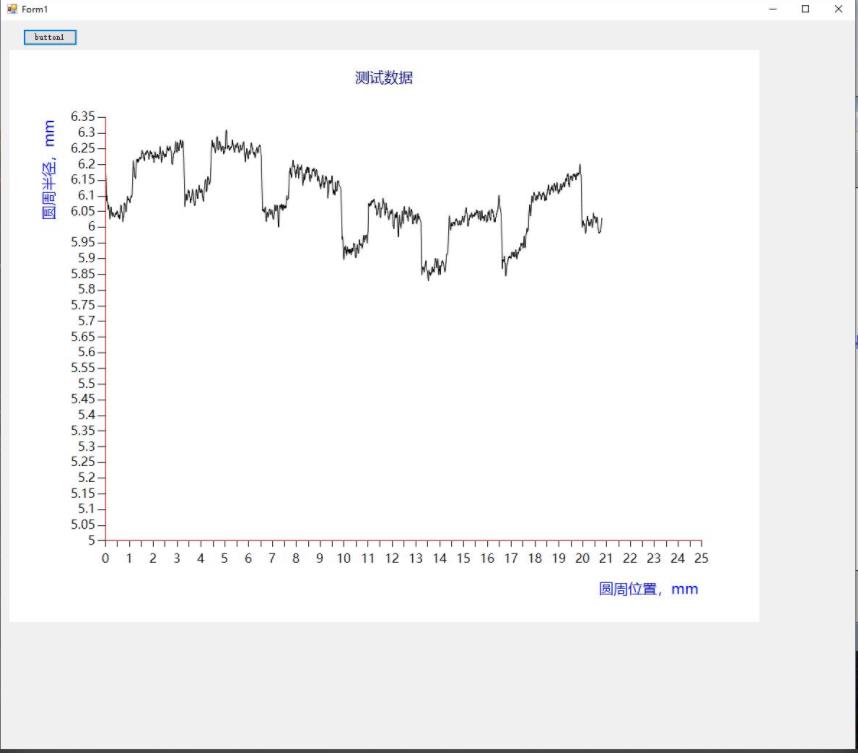
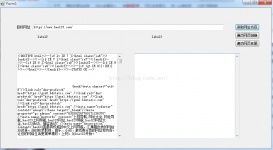
界面
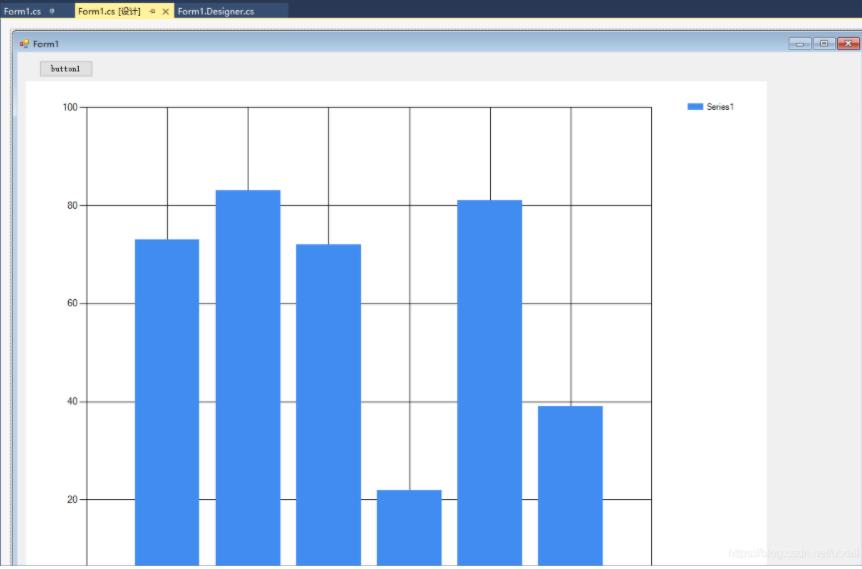
代码
|
1
2
3
4
5
6
7
8
9
10
11
12
13
14
15
16
17
18
19
20
21
22
23
24
25
26
27
28
29
30
31
32
33
34
35
36
37
38
39
40
41
42
43
44
45
46
47
48
49
50
51
52
53
54
55
56
57
58
59
60
61
62
63
64
65
66
67
68
69
70
71
72
73
74
75
76
77
78
79
80
81
82
83
84
85
86
87
88
89
90
91
92
93
94
95
96
97
98
99
100
101
102
103
104
105
106
107
108
109
110
111
112
113
114
115
116
117
118
119
120
121
122
123
124
125
126
127
128
129
130
131
132
133
134
135
136
137
138
139
140
141
142
143
144
145
146
147
148
149
150
151
152
153
154
155
156
157
158
159
160
161
162
163
164
165
166
167
168
169
170
171
172
173
174
|
using System;using System.Collections;using System.Collections.Generic;using System.Drawing;using System.Runtime.InteropServices;using System.Windows.Forms;using System.Windows.Forms.DataVisualization.Charting;namespace WindowsFormsApp2{ public partial class Form1 : Form { //x和y轴数据 double[] x = new double[] { 0, 0, 0, 0, 0, 0, 0, 0, 0, 0 }; double[] y = new double[] { 0, 0, 0, 0, 0, 0, 0, 0, 0, 0 }; List<Double> xList = new List<Double>(); List<Double> yList = new List<Double>(); public Form1() { InitializeComponent(); } private void button1_Click(object sender, EventArgs e) { string fname = ""; OpenFileDialog fdlg = new OpenFileDialog(); fdlg.Title = "Excel File Dialog"; fdlg.InitialDirectory = @"c:\"; fdlg.Filter = "All files (*.*)|*.*|All files (*.*)|*.*"; fdlg.FilterIndex = 2; fdlg.RestoreDirectory = true; if (fdlg.ShowDialog() == DialogResult.OK) { fname = fdlg.FileName; } Microsoft.Office.Interop.Excel.Application xlApp = new Microsoft.Office.Interop.Excel.Application(); Microsoft.Office.Interop.Excel.Workbook xlWorkbook = xlApp.Workbooks.Open(fname); Microsoft.Office.Interop.Excel._Worksheet xlWorksheet = xlWorkbook.Sheets[1]; Microsoft.Office.Interop.Excel.Range xlRange = xlWorksheet.UsedRange; int rowCount = xlRange.Rows.Count; int colCount = xlRange.Columns.Count; for (int i = 1; i <= rowCount; i++) { double px = System.Convert.ToDouble(xlRange.Cells[i, 1].Value2.ToString()); double py = System.Convert.ToDouble(xlRange.Cells[i, 2].Value2.ToString()); Console.Out.WriteLine("第" + i + "行 :" + px + "," + py); xList.Add(px); yList.Add(py); //for (int j = 1; j <= colCount; j++) //{ //write the value to the Grid //if (xlRange.Cells[i, j] != null && xlRange.Cells[i, j].Value2 != null) //{ //xList.Add(xlRange.Cells[i, j]); // Console.WriteLine(xlRange.Cells[i, j].Value2.ToString()); //add useful things here! // } //} } chart1.Series[0].Points.DataBindXY(xList, yList); //cleanup GC.Collect(); GC.WaitForPendingFinalizers(); //rule of thumb for releasing com objects: // never use two dots, all COM objects must be referenced and released individually // ex: [somthing].[something].[something] is bad //release com objects to fully kill excel process from running in the background Marshal.ReleaseComObject(xlRange); Marshal.ReleaseComObject(xlWorksheet); //close and release xlWorkbook.Close(); Marshal.ReleaseComObject(xlWorkbook); //quit and release xlApp.Quit(); Marshal.ReleaseComObject(xlApp); } //Graphics g = this.CreateGraphics(); //Pen pen = new Pen(Brushes.Red, 1); //g.DrawLine(pen, new Point(30, 50), new Point(250, 250)); private void Form1_Load(object sender, EventArgs e) { //控件chart背景色 //chart1.BackColor = Color.Transparent;//Color.Transparent系统定义的颜色 //chart1.BackColor = Color.White; //图表标题, chart1.Titles.Add("测试数据"); //添加title到titleCollection集合的末尾 chart1.Titles[0].ForeColor = Color.DarkBlue;//设置title的文本颜色 chart1.Titles[0].Font = new Font("微软雅黑", 15f, FontStyle.Regular);//设置title的字体 chart1.Titles[0].Alignment = ContentAlignment.TopCenter;//设置title的对齐方式 //图表区chartAreas chart1.ChartAreas[0].BackColor = Color.White;//chartAreas背景颜色 chart1.ChartAreas[0].BorderColor = Color.Red;//chartAreas边框颜色 chart1.ChartAreas[0].BackGradientStyle = GradientStyle.None;//chartAreas背景渐变,不使用 //AxisX表示图表的主x轴; chart1.ChartAreas[0].AxisX.LineColor = Color.Red; //线条颜色 chart1.ChartAreas[0].AxisX.Interval = 0.5;//设置x轴的间隔 chart1.ChartAreas[0].AxisX.Minimum = 0; chart1.ChartAreas[0].AxisX.Maximum = 25;//Y轴坐标固定,不会随绑定的数据而变 chart1.ChartAreas[0].AxisX.LabelStyle.Interval = 1;//设置X轴标签间距,如果不设置默认为x轴的间隔 chart1.ChartAreas[0].AxisX.IsLabelAutoFit = false; chart1.ChartAreas[0].AxisX.LabelStyle.Font = new Font("微软雅黑", 13f, FontStyle.Regular); //标签字体 //设置x轴标题的字体样式和颜色 chart1.ChartAreas[0].AxisX.Title = "圆周位置,mm"; chart1.ChartAreas[0].AxisX.TitleFont = new Font("微软雅黑", 15f, FontStyle.Regular);// 标题字体 chart1.ChartAreas[0].AxisX.TitleForeColor = Color.Blue; //轴标题颜色 chart1.ChartAreas[0].AxisX.TextOrientation = TextOrientation.Horizontal;//轴标题文本方向 chart1.ChartAreas[0].AxisX.TitleAlignment = StringAlignment.Far;//轴标题对齐方式 //X轴网格线 chart1.ChartAreas[0].AxisX.MajorGrid.Enabled = false; //启用网格刻度线,一排竖线 //chart1.ChartAreas[0].AxisX.MajorGrid.LineColor = ColorTranslator.FromHtml("#2c4c6d"); //线条颜色 //chart1.ChartAreas[0].AxisX.MajorGrid.LineColor = Color.Yellow; //y轴 chart1.ChartAreas[0].AxisY.LineColor = Color.Red; //线条颜色 chart1.ChartAreas[0].AxisY.Interval = 0.05;//设置Y轴的间隔 chart1.ChartAreas[0].AxisY.Minimum = 5;//Y轴坐标固定,不会随绑定的数据而变 chart1.ChartAreas[0].AxisY.Maximum = 6.35;//Y轴坐标固定,不会随绑定的数据而变 chart1.ChartAreas[0].AxisY.LabelStyle.Interval = 0.05;//设置X轴标签间距,如果不设置默认为x轴的间隔 //Y坐标轴标题 chart1.ChartAreas[0].AxisY.Title = "圆周半径,mm"; //轴标题 chart1.ChartAreas[0].AxisY.TitleFont = new Font("微软雅黑", 15f, FontStyle.Regular); //标题字体 chart1.ChartAreas[0].AxisY.TitleForeColor = Color.Blue; //轴标题颜色 chart1.ChartAreas[0].AxisY.TextOrientation = TextOrientation.Rotated270; //标题文本方向 chart1.ChartAreas[0].AxisY.TitleAlignment = StringAlignment.Far; //y轴标签样式 chart1.ChartAreas[0].AxisY.LabelStyle.ForeColor = Color.Black; //标签颜色 chart1.ChartAreas[0].AxisY.LabelStyle.Font = new Font("微软雅黑", 13f, FontStyle.Regular); //标签字体 //Y轴网格线条 chart1.ChartAreas[0].AxisY.MajorGrid.Enabled = false;//一排横线 //chart1.ChartAreas[0].AxisY.MajorGrid.LineColor = Color.Yellow; //#VAL为y轴的值,#VALX为x轴数据 //chart1.Series[0].Label = "hello";//数据点标签文本 //chart1.Series[0].Label = "#VAL";//数据点标签为其对于的y值 //chart1.Series[0].LabelBackColor = Color.Blue; //数据点标签背景色 //chart1.Series[0].LabelForeColor = Color.White; //数据点标签颜色 //chart1.Series[0].Color = Color.Red; //数据点颜色,数据点之间曲线的颜色 //chart1.Series[0].BorderWidth = 3;//数据点边框宽度,曲线的宽度 //chart1.Series[0].ToolTip = "#VALX:#VAL";//鼠标移动到对应点显示数值 元素的工具提示 chart1.Series[0].ChartType = SeriesChartType.Spline; //图表类型(折线) 绘制该序列的图表类型 Legend legend = new Legend("波形显示");//初始化具有指定的图例名称 legend.Title = "legendTitle"; //图例标题文本 chart1.Series[0].LegendText = legend.Name; //图例中项的文本 chart1.Legends.Add(legend); chart1.Legends[0].Position.Auto = false; //图例矩形位置 - 元素自动定位标志 //绑定数据 //数据绑定到指定数据源的第一列的x值和y值的集合的数据点 chart1.Series[0].Color = Color.Black; chart1.Series[0].Points.DataBindXY(x, y); } }} |
以上就是本文的全部内容,希望对大家的学习有所帮助,也希望大家多多支持服务器之家。
原文链接:https://blog.csdn.net/uotail/article/details/89889711


