Golang线上内存爆掉问题排查(pprof)
1 问题描述
某天,售后同事反馈,我们服务宕掉了,客户无法预览我们的图片了。
- 我们预览图片是读取存储在我们S3服务的数据,然后返回给前端页面展示。
- 因为客户存在几百M的图片,所以一旦请求并发一上来,很容易就把内存打爆。
2 pprof分析
声明: 涉及到数据敏感,以下代码是我模拟线上故障的一个情况。
好在我们程序都有添加pprof监控,于是直接通过go tool pprof分析:
①获取堆内存分配情况:go tool pprof http://xx/debug/pprof/heap
# localhost直接改成自己程序的IP:端口
go tool pprof http://localhost:80/debug/pprof/heap
与解决")
②过滤出占用堆内存前10的方法:top 10
# 过滤占用堆内存排名前10方法
top 10
与解决")
参数解析:
- flat:表示此函数分配、并由该函数持有的内存空间。
- cum:表示由这个函数或它调用堆栈下面的函数分配的内存总量。
③查看方法详情:list testReadAll
可以看到我们自己程序的方法是main包下面的testAll方法占用了875MB多内存。
# 查看方法详情
list testReadAll
与解决")
最后定位到ioutil.ReadAll这个方法占用了太多内存。
- 熟悉的朋友都清楚,ioutil.ReadAll是直接将文件或者流数据一次性读取到内存里。如果文件过大或者多个请求同事读取多个文件,会直接将服务器内存打爆。
因为我们的客户有几百M的图片,所以一旦并发以上来很可能打爆。因此这里需要改成流式的io.Copy。
3 解决:改用流式io.Copy()
定位到问题后,直接改用流式方式给前端返回。
_, err = io.Copy(ctx.ResponseWriter(), file)
由于这次新人的失误,加上测试数据量不够大,导致出现线上问题,所以大家以后还是要多review代码+增加压力测试。
4 本地测试io.Copy与ioutil.ReadAll
编写demo代码
package main

import (
	"github.com/kataras/iris/v12"
	"github.com/kataras/iris/v12/context"
	"io"
	"io/ioutil"
	"net/http"
	_ "net/http/pprof"
	"os"
)

func main() {
	app := iris.New()
	go func() {
		http.ListenAndServe(":80", nil)
	}()
	//readAll
	app.Get("/readAll", testReadAll)
	//io.Copy
	app.Get("/ioCopy", func(ctx *context.Context) {
		file, err := os.Open("/Users/ziyi2/GolandProjects/MyTest/demo_home/io_copy_demo/xx.zip")
		if err != nil {
			panic(err)
		}
		defer file.Close()
		_, err = io.Copy(ctx.ResponseWriter(), file)
		if err != nil {
			panic(err)
		}
	})
	app.Listen(":8080", nil)
}

func testReadAll(ctx *context.Context) {
	file, err := os.Open("/Users/ziyi2/GolandProjects/MyTest/demo_home/io_copy_demo/xx.zip")
	if err != nil {
		panic(err)
	}
	defer file.Close()
	//simulate onLine err
	bytes, err := ioutil.ReadAll(file)
	if err != nil {
		panic(err)
	}
	_, err = ctx.Write(bytes)
	if err != nil {
		panic(err)
	}
}
打开资源监视器,同时发起readAll请求,观察内存占用
- 发起readAll请求前
与解决")
- 发送readAll请求
localhost:8080/readAll
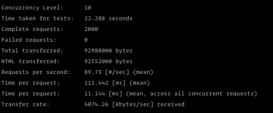
我本地是模拟读取差不多1G左右的文件,可以看到ioutil.ReadAll直接一次性将内容读取到了内存。(一旦并发量上来,或者图片文件超大,后果不敢想象)
与解决")
再观察io.Copy方法
- 发送ioCopy请求
localhost:8080/ioCopy
- 流式传输,最后程序内存并没有暴涨
与解决")
与解决")
结论:
ioutil.ReadAll:会将数据一次性加载到内存。
io.Copy:流式拷贝,不会导致内存暴涨
因此对于大文件或者数据量不确定的场景推荐使用io.Copy
拓展:pprof使用
① 引入pprof
- 引入pprof包
- 开启一个协程监听
package main

import (
	"github.com/kataras/iris/v12"
	"github.com/kataras/iris/v12/context"
	"net/http"
	_ "net/http/pprof"
	"os"
)

func main() {
	app := iris.New()
	go func() {
		http.ListenAndServe(":80", nil)
	}()
	app.Listen(":8080", nil)
}
②查看分析报告
1 浏览器直接访问
http://IP:Port/debug/pprof
与解决")
2 go tool 命令行直接分析
# 查看堆内存信息
go tool pprof http://IP:Port/debug/pprof/heap

# 查看cpu信息
go tool pprof http://IP:Port/debug/pprof/profile

## -seconds=5设置采样时间为5s
# go tool pprof -seconds=5 http://IP:Port/debug/pprof/profile

# 查看协程信息
go tool pprof http://IP:Port/debug/pprof/goroutine

# 查看代码阻塞信息
go tool pprof http://IP:Port/debug/pprof/block

# 需要查看什么信息将URL默认的Type更换为对应类型即可
-seconds=30 设置采样30s,也可以自定义时间范围。需要注意的是,对于profile而言,总是需要采样一段时间,才可以看到数据。而其他历史累计的数据,则可以直接获取从程序开始运行到现在累积的数据,也可以设置-seconds来获取一段时间内的累计数据。而其他实时变化的指标,设置这个参数没什么用,只会让你多等一会。
- allocs: A sampling of all past memory allocations【所有内存分配,历史累计】
- block: Stack traces that led to blocking on synchronization primitives【导致阻塞同步的堆栈,历史累计】
- cmdline: The command line invocation of the current program【当前程序命令行的完整调用路径】
- goroutine: Stack traces of all current goroutines. Use debug=2 as a query parameter to export in the same format as an unrecovered panic.【当前所有运行的goroutine堆栈信息,实时变化】
- heap: A sampling of memory allocations of live objects. You can specify the gc GET parameter to run GC before taking the heap sample.【查看活动对象的内存分配情况,实时变化】
- mutex: Stack traces of holders of contended mutexes【导致互斥锁竞争持有者的堆栈跟踪,历史累计】
- profile: CPU profile. You can specify the duration in the seconds GET parameter. After you get the profile file, use the go tool pprof command to investigate the profile.【默认进行30s的CPU Profing,用于观察CPU使用情况】
- threadcreate: Stack traces that led to the creation of new OS threads【查看创建新OS线程的堆栈跟踪信息】
- trace: A trace of execution of the current program. You can specify the duration in the seconds GET parameter. After you get the trace file, use the go tool trace command to investigate the trace.【当前程序执行链路】
注意:默认情况下是不追踪block和mutex的信息的,如果想要看这两个信息,需要在代码中加上两行:
runtime.SetBlockProfileRate(1) // 开启对阻塞操作的跟踪,block
runtime.SetMutexProfileFraction(1) // 开启对锁调用的跟踪,mutex
3 导出为.out文件+命令行分析(推荐)
推荐使用导出文件方式,虽然步骤繁琐,但是有文件落地,保证重要数据不会丢失
//导出为文件
curl -o heap.out http://IP:Port/debug/pprof/heap

//解析文件并进入命令行交互
go tool pprof heap.out
//后续操作就和命令行直接分析如出一辙

//top 10
//list funcName
与解决")
③参数解析
1 采样类型
allocs:所有内存分配,历史累计
allocs: A sampling of all past memory allocations【所有内存分配,历史累计】
block:导致阻塞同步的堆栈信息,历史累计(每发生一次阻塞取样一次)
block: Stack traces that led to blocking on synchronization primitives【导致阻塞同步的堆栈,历史累计】
- Block Goroutine阻塞事件的记录 默认每发生一次阻塞事件时取样一次
cmdline:程序命令行的完整调用路径
cmdline: The command line invocation of the current program【当前程序命令行的完整调用路径】
goroutine:当前程序运行的所有goroutine,实时变化(获取时取样一次)
goroutine: Stack traces of all current goroutines. Use debug=2 as a query parameter to export in the same format as an unrecovered panic.【当前所有运行的goroutine堆栈信息,实时变化】
- 活跃Goroutine信息的记录 仅在获取时取样一次
heap:查看堆内存分配情况,实时变化(每分配512K取样一次)
heap: A sampling of memory allocations of live objects. You can specify the gc GET parameter to run GC before taking the heap sample.【查看活动对象的内存分配情况,实时变化】
- Heap 堆内存分配情况的记录 默认每分配512K字节时取样一次
mutex:导致互斥锁竞争的堆栈跟踪,历史累计
mutex: Stack traces of holders of contended mutexes【导致互斥锁竞争持有者的堆栈跟踪,历史累计】
profile:CPU使用情况
profile: CPU profile. You can specify the duration in the seconds GET parameter. After you get the profile file, use the go tool pprof command to investigate the profile.【默认进行30s的CPU Profing,用于观察CPU使用情况】
threadcreate:创建新线程的堆栈信息(获取时取样)
threadcreate: Stack traces that led to the creation of new OS threads【查看创建新OS线程的堆栈跟踪信息】
- 系统线程创建情况的记录 仅在获取时取样一次
trace:程序整个执行链路
trace: A trace of execution of the current program. You can specify the duration in the seconds GET parameter. After you get the trace file, use the go tool trace command to investigate the trace.【当前程序执行链路】
注意:默认情况下是不追踪block和mutex的信息的,如果想要看这两个信息,需要在代码中加上两行:
runtime.SetBlockProfileRate(1) // 开启对阻塞操作的跟踪,block
runtime.SetMutexProfileFraction(1) // 开启对锁调用的跟踪,mutex
2 统计维度(以内存取样为例)
如果是初次接触pprof,可能会疑惑flat、sum、cum代表什么意思
与解决")
官网解析:
- The first two columns show the number of samples in which the function was running (as opposed to waiting for a called function to return), as a raw count and as a percentage of total samples.
- The third column shows the running total during the listing.
- The fourth and fifth columns show the number of samples in which the function appeared (either running or waiting for a called function to return). To sort by the fourth and fifth columns, use the -cum (for cumulative) flag.
- 官网地址:https://go.dev/blog/pprof
以获取内存为例:
flat:当前函数分配的内存,不包含它调用其他函数造成的内存分配
flat%:当前函数分配内存占比
sum%:自己和前面所有的flat%累积值
cum:当前函数及当前函数调用其他函数的分配内存的汇总
cum%:这个函数分配的内存,以及它调用其他函数分配的内存之和
以上就是Golang线上内存爆掉问题排查(pprof)与解决的详细内容,更多关于Golang线上内存爆掉的资料请关注服务器之家其它相关文章!
原文链接:https://blog.csdn.net/weixin_45565886/article/details/137158092