在开发过程中,从一开始到应用程序的推出都充满了挑战,而负载测试则是其中至关重要的一项工作。这一阶段不仅仅是走过场,而是要进行严格的评估,确保应用程序的性能符合预期。在测试过程中发现性能不佳或意外瓶颈是常见的障碍,但这也是改进的关键时刻。
有了合适的剖析工具,开发人员就能迅速从诊断过渡到有针对性的改进,避免漫无目的的故障排除带来的隐患。这种简化的方法不仅节省了宝贵的开发时间,还强调了负载测试和剖析作为追求最佳应用程序性能不可或缺的工具的重要性。
Go 从一开始就配备了出色的工具,帮助开发人员进行负载测试。在参与过使用 Elixir 的项目后,Erlang 中大量的性能测量工具给我留下了深刻印象,而 Go 提供的工具同样令人印象深刻。本文将探讨如何使用这些工具。

一、pprof
pprof 是 Go 专用的剖析器,可轻松确定 CPU 时间用在哪里,内存分配在哪里。获取配置文件的方法因命令行应用程序和网络应用程序而异。
1.cpu pprof
对于 CPU 剖析,可在感兴趣的代码段前后调用 pprof.StartCPUProfile() 和 pprof.StopCPUProfile(),并将输出保存到指定文件(在示例中为 $TMPDIR)。
package main

import (
 "fmt"
 "os"
 "path"
 "runtime/pprof"
)

func main() {
 // Create a file to save the measurement results
 fname := path.Join(os.TempDir(), "cpuprofile.out")
 cpuFile, err := os.Create(fname)

 if err != nil {
  fmt.Println(err)
  return
 }

 // Conduct the measurement pprof.StartCPUProfile(cpuFile)
 defer pprof.StopCPUProfile()

 // Perform a heavy operation
}
执行上述代码并生成 cpuprofile.out 输出后,可以将其加载到 pprof 中查看剖析信息。
> go tool pprof /pathtotmpdir/cpuprofile.out
Type: cpu
Time: Dec 17, 2022 at 7:40am (JST)
Duration: 606.44ms, Total samples = 390ms (64.31%)
Entering interactive mode (type "help" for commands, "o" for options)
(pprof)
运行提供的代码并将输出加载到 pprof 中,可以检查配置文件信息。输入 "top "可显示十大耗时条目。
(pprof) top
Showing nodes accounting for 390ms, 100% of 390ms total
      flat  flat%   sum%        cum   cum%
     380ms 97.44% 97.44%      390ms   100%  main.Prime (inline)
      10ms  2.56%   100%       10ms  2.56%  runtime.asyncPreempt
         0     0%   100%      390ms   100%  main.main
         0     0%   100%      390ms   100%  runtime.main
(pprof)
-cum选项可检索每个函数的累计时间。
(pprof) top -cum
Showing nodes accounting for 390ms, 100% of 390ms total
      flat  flat%   sum%        cum   cum%
     380ms 97.44% 97.44%      390ms   100%  main.Prime (inline)
         0     0% 97.44%      390ms   100%  main.main
         0     0% 97.44%      390ms   100%  runtime.main
      10ms  2.56%   100%       10ms  2.56%  runtime.asyncPreempt
(pprof)
list命令显示了功能的使用时间。
(pprof) list main.Prime
Total: 390ms
ROUTINE ======================== main.Prime in /Users/username/dev/mastering-Go-3rd/ch11/blog/clacpuprofile.go
     380ms      390ms (flat, cum)   100% of Total
         .          .     26:   }
         .          .     27:   fmt.Println("Total primes:", total)
         .          .     28:}
         .          .     29:
         .          .     30:func Prime(n int) bool {
     120ms      130ms     31:   for i := 2; i < n; i++ {
     260ms      260ms     32:           if (n % i) == 0 {
         .          .     33:                   return false
         .          .     34:           }
         .          .     35:   }
         .          .     36:   return true
         .          .     37:}
(pprof)
2.http pprof
对于网络应用程序,导入 net/http/pprof 会收集可在 /debug/pprof 端点访问的配置文件信息。
package main
import (
 "net/http"
 "net/http/pprof"
)
func NewHttpServer(addr string) *http.Server {
 httpsrv := newHttpServer()
 r := mux.NewRouter()
 r.HandleFunc("/", httpsrv.handleFoo).Methods("POST")
 r.HandleFunc("/", httpsrv.handleBar).Methods("GET")
 r.HandleFunc("/debug/pprof/", pprof.Index)
 r.HandleFunc("/debug/pprof/cmdline", pprof.Cmdline)
 r.HandleFunc("/debug/pprof/profile", pprof.Profile)
 r.HandleFunc("/debug/pprof/symbol", pprof.Symbol)
 r.HandleFunc("/debug/pprof/trace", pprof.Trace)
 srv := server.NewHttpServer(":8080")
 log.Fatal(srv.ListenAndServe())
}
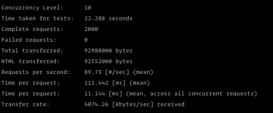
http pprof 支持与 CPU pprof 类似的配置文件检查命令,即使在应用程序停止后也能对配置文件进行检查。
> go tool pprof http://localhost:8080/debug/pprof/profile
Fetching profile over HTTP from http://localhost:8080/debug/pprof/profile
Saved profile in /Users/username/pprof/pprof.samples.cpu.002.pb.gz
Type: cpu
Time: Feb 8, 2023 at 11:12pm (JST)
Duration: 30s, Total samples = 270ms (  0.9%)
Entering interactive mode (type "help" for commands, "o" for options)
(pprof) top
Showing nodes accounting for 270ms, 100% of 270ms total
Showing top 10 nodes out of 67
      flat  flat%   sum%        cum   cum%
      90ms 33.33% 33.33%       90ms 33.33%  syscall.syscall
      80ms 29.63% 62.96%       80ms 29.63%  runtime.pthread_cond_signal
      50ms 18.52% 81.48%       50ms 18.52%  runtime.kevent
      30ms 11.11% 92.59%       30ms 11.11%  runtime.pthread_cond_wait
      20ms  7.41%   100%       20ms  7.41%  syscall.syscall6
         0     0%   100%       10ms  3.70%  bufio.(*Reader).Peek
         0     0%   100%       20ms  7.41%  bufio.(*Reader).ReadLine
         0     0%   100%       20ms  7.41%  bufio.(*Reader).ReadSlice
         0     0%   100%       30ms 11.11%  bufio.(*Reader).fill
         0     0%   100%       30ms 11.11%  bufio.(*Writer).Flush
go tool pprof -http :9402 /Users/username/pprof/pprof.samples.cpu.002.pb.gz
在我们的项目中,我们经常通过 k8s 上的端口转发访问配置文件信息。
kubectl port-forward -n $namespace localhost 8080:8000
# This allows access at localhost:8000/debug/pprof/profile
3.callgraph
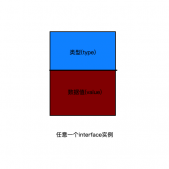
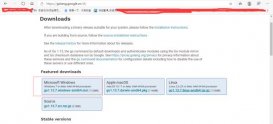
除了 CLI 验证外,您还可以使用 Web 界面在浏览器中查看调用图(这非常棒)。在与之前相同的命令中添加 -http 选项即可。您还可以下载并指定配置文件以供审查。
> go tool pprof -http :8888 http://localhost:8080/debug/pprof/profile
Fetching profile over HTTP from http://localhost:8080/debug/pprof/profile
Saved profile in /Users/username/pprof/pprof.samples.cpu.004.pb.gz
Serving web UI on http://localhost:8888
有了调用图,您就可以快速了解程序正在调用哪些进程。

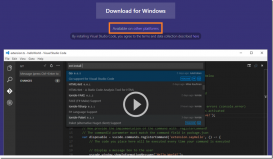
4.火焰图
火焰图直观显示应用程序花费的时间,可点击框架深入检查方法。

您可以点击每个帧,进一步检查方法内部的内容
5.检测内存泄漏
通过比较改进前和改进后的配置文件,大大方便了内存泄漏的检测,从而方便了泄漏解决方案的识别和验证。
# before improvement
noglob curl -s http://localhost:8080/debug/pprof/profile > /tmp/profile-before.prof

# after improvement
noglob curl -s http://localhost:8080/debug/pprof/profile > /tmp/profile-after.prof

# Check the difference before and after
go tool pprof -http: 8000 --diff_base /tmp/profile-before.prof /tmp/profile-after.prof
对于内存泄漏调查,可以指定堆配置文件集合。
go tool pprof http://localhost:8080/debug/pprof/heap?seconds=10

# Continue processing for a fixed period before retrieving again
go tool pprof http://localhost:8080/debug/pprof/heap?seconds=10

# Check the difference (can also be viewed in the web interface with the -http option)
go tool pprof --diff_base=/Users/username/pprof/pprof.alloc_objects.alloc_space.inuse_objects.inuse_space.001.pb.gz /Users/username/pprof/pprof.alloc_objects.alloc_space.inuse_objects.inuse_space.002.pb.gz

(pprof) top
Showing nodes accounting for 12.92GB, 295.37% of 4.38GB total
Dropped 2 nodes (cum <= 0.02GB)
      flat  flat%   sum%        cum   cum%
   12.92GB 295.37% 295.37%    12.93GB 295.56%  main.main
         0     0% 295.37%    12.93GB 295.56%  runtime.main
(pprof) top 20
Showing nodes accounting for 12.92GB, 295.37% of 4.38GB total
Dropped 2 nodes (cum <= 0.02GB)
      flat  flat%   sum%        cum   cum%
   12.92GB 295.37% 295.37%    12.93GB 295.56%  main.main
         0     0% 295.37%    12.93GB 295.56%  runtime.main
(pprof) list main.
Total: 4.38GB
ROUTINE ======================== main.main in /Users/username/dev/proglog/cmd/server/main.go
   12.92GB    12.93GB (flat, cum) 295.56% of Total
         .          .     15:
二、trace
trace 可让用户深入了解运行时如何调度 goroutine,为调查争用问题或 GC 问题提供有关堆、操作系统线程数和 goroutine 状态的宝贵数据。在命令行应用程序中可通过 runtime/trace 软件包访问,在网络应用程序中可通过 net/http 软件包访问。
# fetch trace with executing web application
noglob curl http://localhost:8080/debug/pprof/trace?seconds=10 > /tmp/pprof.trace
# chech the trace
go tool trace /tmp/pprof.trace

总结
总而言之,从开发到部署的整个过程都离不开基本的负载测试和性能剖析。利用 Go 的 pprof 和跟踪工具,开发人员可以深入了解性能瓶颈、CPU 使用率和内存分配情况。
可视化调用图和火焰图的功能进一步帮助找出效率低下的问题,从而进行精确的优化。利用这些工具不仅能加强调试过程,还能显著提高应用程序的性能。采用这些方法对于确保我们的应用程序稳健高效、随时满足实际需求至关重要。
原文地址:https://mp.weixin.qq.com/s?__biz=MzU0MDkyOTg5Nw==&mid=2247485378&idx=1&sn=b5fc95b3aab45dd67d3b465854002b41