本文将了解什么?
1、设置背景风格
-
使用
set_style设置图形背景风格 - 不同子图使用不同背景风格
- 自定义背景风格
2、设置外框(脊柱)
3、图形缩放
4、同时设置背景|图形缩放
1、设置背景风格
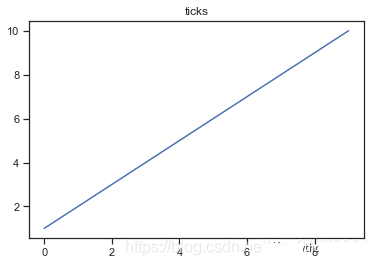
使用set_style设置图形背景风格
#seaborn包含5中背景风格darkgrid, whitegrid, dark, white, ticks,默认为dark
#set_style()修改风格,以下展示5种风格差异
import numpy as np
import seaborn as sns
import matplotlib.pyplot as plt
for i in list("darkgrid, whitegrid, dark, white, ticks".split(", ")):
    sns.set_style(style="%s"%i)
    plt.figure()
    plt.plot(range(10),[i+1 for i in range(10)])
    plt.title("%s"%i)
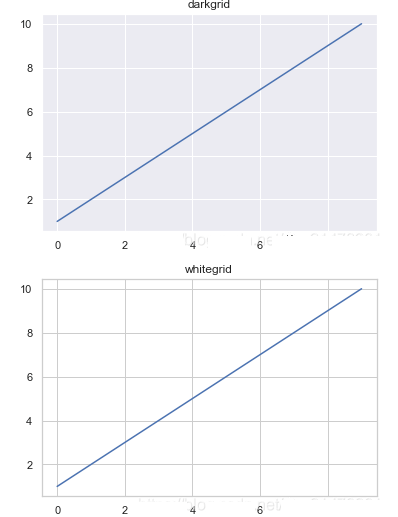
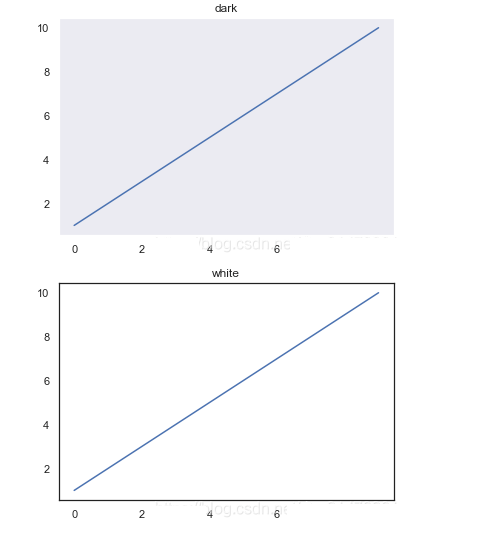
不同子图使用不同背景风格
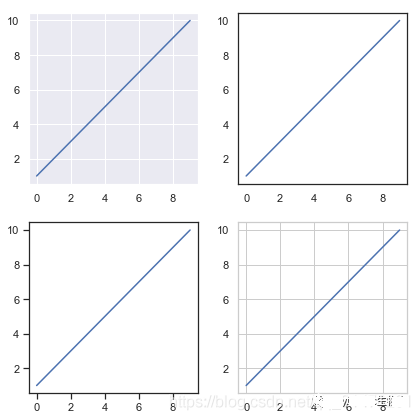
axes_style() 结合with
f = plt.figure(figsize=(6, 6))
gs = f.add_gridspec(2, 2)

with sns.axes_style("darkgrid"):
    ax = f.add_subplot(gs[0, 0])
    plt.plot(range(10),[i+1 for i in range(10)])

with sns.axes_style("white"):
    ax = f.add_subplot(gs[0, 1])
    plt.plot(range(10),[i+1 for i in range(10)])

with sns.axes_style("ticks"):
    ax = f.add_subplot(gs[1, 0])
    plt.plot(range(10),[i+1 for i in range(10)])

with sns.axes_style("whitegrid"):
    ax = f.add_subplot(gs[1, 1])
    plt.plot(range(10),[i+1 for i in range(10)])

f.tight_layout()
自定义背景风格
sns.axes_style("darkgrid")#输出"darkgrid"默认配置

{"figure.facecolor": "white",
 "axes.labelcolor": ".15",
 "xtick.direction": "out",
 "ytick.direction": "out",
 "xtick.color": ".15",
 "ytick.color": ".15",
 "axes.axisbelow": True,
 "grid.linestyle": "-",
 "text.color": ".15",
 "font.family": ["sans-serif"],
 "font.sans-serif": ["Arial",
  "DejaVu Sans",
  "Liberation Sans",
  "Bitstream Vera Sans",
  "sans-serif"],
 "lines.solid_capstyle": "round",
 "patch.edgecolor": "w",
 "patch.force_edgecolor": True,
 "image.cmap": "rocket",
 "xtick.top": False,
 "ytick.right": False,
 "axes.grid": True,
 "axes.facecolor": "#EAEAF2",
 "axes.edgecolor": "white",
 "grid.color": "white",
 "axes.spines.left": True,
 "axes.spines.bottom": True,
 "axes.spines.right": True,
 "axes.spines.top": True,
 "xtick.bottom": False,
 "ytick.left": False}
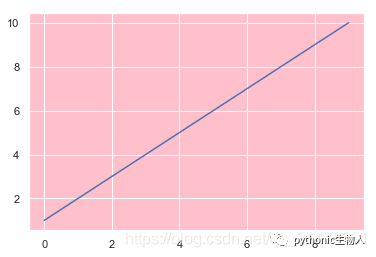
sns.set_style("darkgrid", {"axes.facecolor": "pink"})#修改背景色
plt.plot(range(10),[i+1 for i in range(10)])
2、设置外框(脊柱)
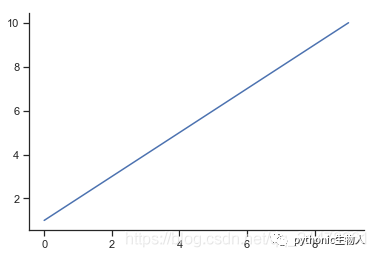
seaborn.despine

plt.plot(range(10),[i+1 for i in range(10)])
sns.despine(fig=None, ax=None,
            top=True, right=True, left=False, bottom=False, #上,右,左,下外框开关
            offset=None, trim=False
           )
3、图形缩放
plotting_context() set_context()
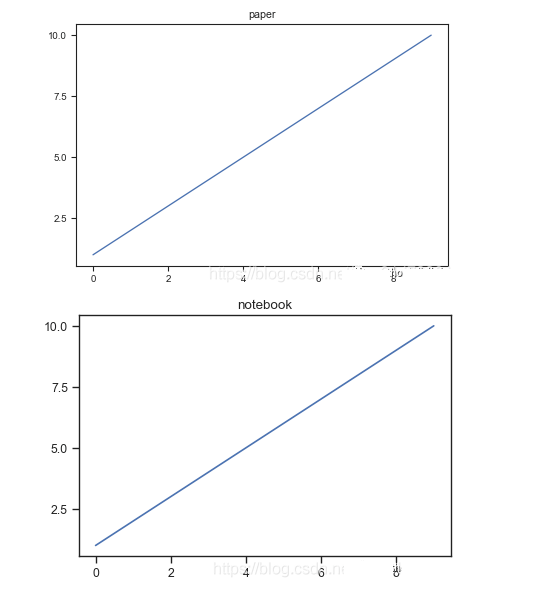
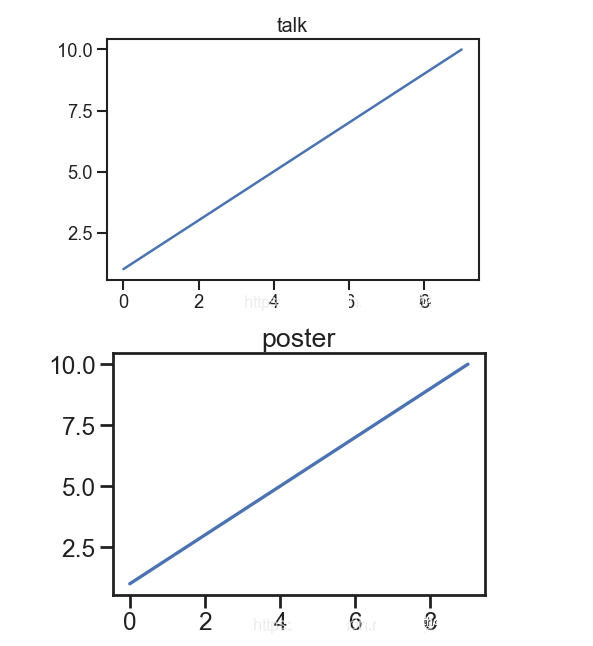
#seaborn包含4模式可选:paper,notebook,talk,poster,默认为notebook
#set_context()修改模式,以下展示4种风格差异
for i in list("paper,notebook,talk,poster".split(",")):
    sns.set_context(context="%s"%i)
    plt.figure(dpi=80)
    plt.plot(range(10),[i+1 for i in range(10)])
    plt.title("%s"%i)
4、同时设置背景|图形缩放
set()
sns.set(context="notebook", #设置缩放
        style="darkgrid", #设置背景风格
        palette="deep", #设置colormap
        font="sans-serif", font_scale=1, color_codes=True, rc=None)
到此这篇关于Python可视化之seborn图形外观设置的文章就介绍到这了,更多相关seborn图形外观设置内容请搜索服务器之家以前的文章或继续浏览下面的相关文章希望大家以后多多支持服务器之家!
原文地址:https://mp.weixin.qq.com/s?__biz=MzUwOTg0MjczNw==&mid=2247485930&idx=1&sn=076cb048ef92c6198ce08d636853be2a&


